Contribution margin is what is left from a sale after you subtract the variable costs of making and delivering it. It tells you how much each sale actually contributes to covering your fixed costs and profit. Most brands track one version of it. The sharper ones track three, CM1, CM2 and CM3, because the third one is the number that decides whether you can scale with profit or just scale your losses.
What is contribution margin?
Contribution margin is revenue minus the variable costs tied to that revenue. Variable costs are the ones that move with each sale: the product itself, shipping, payment fees, the cost of acquiring the customer. Fixed costs, like rent or salaries, sit outside it.
It is easy to confuse with two other numbers. Gross margin usually stops at the cost of the product. Net profit is what is left after everything, including fixed costs. Contribution margin sits in between, and it answers a specific question: does one more sale make you money, or cost you money, before fixed costs even enter the picture? For a brand deciding whether to spend more on acquisition, that is the question that matters.
CM1, CM2 and CM3: what each layer means
Tracking contribution margin in three layers shows you exactly where the money goes between the sale and the profit. Definitions vary slightly between companies, but this is the common structure:
- CM1 = revenue − COGS. The margin on the product itself, before anything else. This is the cleanest, healthiest-looking number.
- CM2 = CM1 − variable fulfillment costs. Subtract shipping, fulfillment, payment fees and returns. This is what is left after you have actually delivered the order.
- CM3 = CM2 − acquisition cost. Subtract the marketing spend it took to win the customer (CAC). This is the number that tells you whether growth pays for itself.
A worked example makes the drop obvious. Take a product sold for $50:
| Layer | Calculation | Result | Margin |
|---|---|---|---|
| Revenue | — | $50 | — |
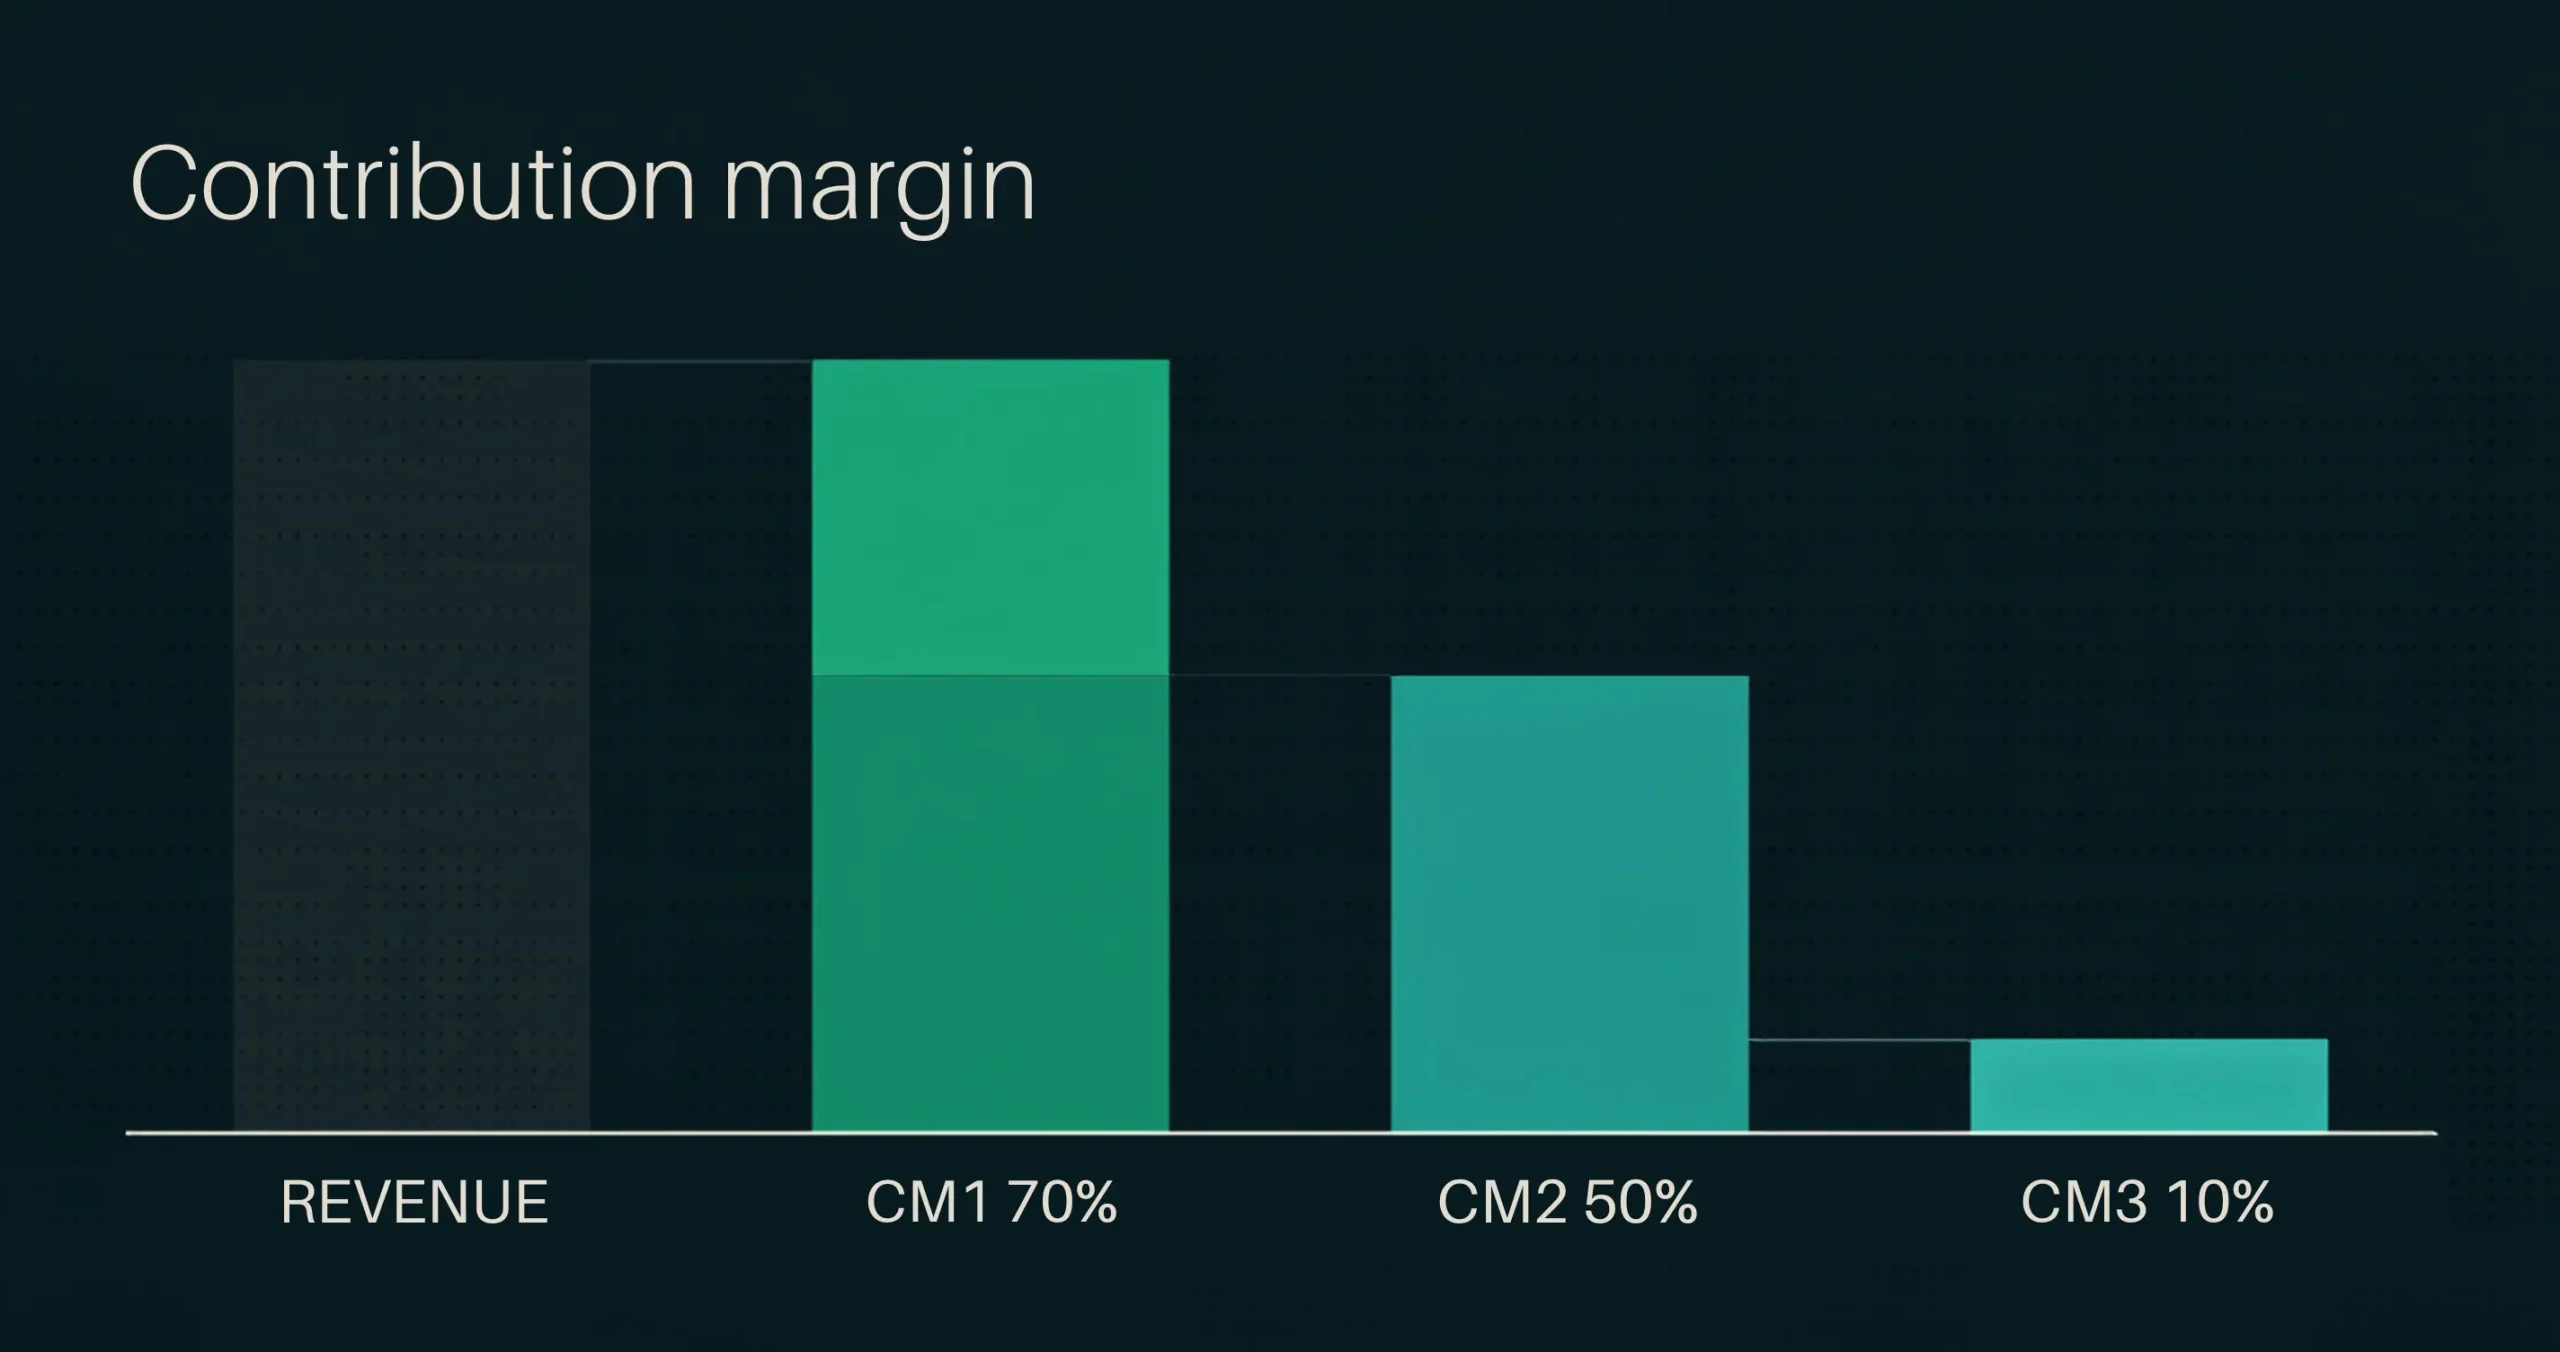
| CM1 | $50 − $15 COGS | $35 | 70% |
| CM2 | $35 − $10 shipping, fees, returns | $25 | 50% |
| CM3 | $25 − $20 acquisition (CAC) | $5 | 10% |
The product looks great at CM1 (70%). It still looks healthy at CM2 (50%). Then acquisition takes almost everything, and CM3 lands at 10%. A brand that only watches CM1 thinks it has a 70% margin business. The reality is a 10% business once you pay to get the customer, and that gap is where most growth plans quietly fail.
Why CM3 is the number that decides whether you can scale
Scaling means spending more to acquire more customers. If CM3 is positive, every extra customer you buy still contributes after the cost of acquiring them, so spending more makes sense. If CM3 is negative, every extra customer loses money, and scaling just makes the hole bigger, faster.
This is why CM1 and CM2 can be misleading on their own. A brand can have a beautiful product margin and still go broke growing, because the acquisition cost it takes to grow eats the whole thing. CM3 is the honest test. It is also the number we watch most closely when a brand decides whether it can afford to scale a channel or enter a new market, because it answers the only question that matters there: does growth pay for itself?
How to calculate your contribution margin
You can do this for a single product, a channel, or the whole business. The steps are the same:
- Start with revenue for the period or the unit.
- Subtract COGS to get CM1.
- Subtract shipping, fulfillment, payment fees and returns to get CM2.
- Subtract acquisition cost (total marketing spend divided by customers acquired) to get CM3.
Two things make or break the accuracy. First, count returns honestly, because a generous returns policy quietly moves CM2 down and brands forget to include it. Second, attribute acquisition cost properly: blended CAC across all channels hides which channels actually pay back. If you want to know whether a specific channel can scale, calculate CM3 for that channel, not for the business as a whole.
Common mistakes brands make with contribution margin
The first is managing to CM1 and assuming the rest takes care of itself. It does not. The whole point of the three layers is that the number gets less flattering and more honest as you go down.
The second is leaving costs out of CM2, usually returns and payment fees, which makes the margin look better than it is. The third is using one blended CAC for everything, which averages a profitable channel and a loss-making one into a number that tells you nothing about either. The fourth is treating contribution margin as an accounting exercise instead of a decision tool. The reason to track it is to decide where to spend next, not to fill in a report.
How contribution margin connects to growth decisions
Contribution margin is where strategy meets arithmetic. Whether you should scale a channel, raise prices, cut a product, or enter a new market all come down to what happens to CM3 when you do. That is why it runs through how we work: in the Klevie Growth Engine, the diagnosis checks whether the unit economics can survive growth before any spend scales. And when we help European brands enter the US market, positive CM3 is the signal that the entry is working, because a new market with high acquisition costs is exactly where a thin CM3 turns fatal.
Track it in three layers, be honest about CM2, attribute CAC by channel, and you turn contribution margin from a number in a spreadsheet into the test that tells you what to do next.
Frequently asked questions
What is contribution margin in simple terms?
It is what is left from a sale after subtracting the variable costs tied to it, like product cost, shipping, payment fees and acquisition. It shows how much each sale contributes toward fixed costs and profit.
What is the difference between CM1, CM2 and CM3?
CM1 is revenue minus COGS. CM2 is CM1 minus variable fulfillment costs like shipping, fees and returns. CM3 is CM2 minus the cost of acquiring the customer (CAC). CM3 is the one that shows whether growth pays for itself.
Why is CM3 important for scaling?
Scaling means spending more to acquire more customers. If CM3 is positive, each extra customer still contributes after acquisition cost, so scaling makes sense. If CM3 is negative, scaling multiplies losses.
How do you calculate contribution margin?
Start with revenue, subtract COGS for CM1, subtract shipping, fulfillment, fees and returns for CM2, then subtract acquisition cost for CM3. Do it per product or per channel for the most useful view.
Is contribution margin the same as gross margin?
No. Gross margin usually stops at the cost of the product. Contribution margin also subtracts the other variable costs of the sale, such as fulfillment and acquisition, which gives a truer picture of whether a sale makes money.
Not sure your unit economics can carry growth?
That is exactly what our diagnosis checks first. Request a strategy call and we will look at whether your CM3 can survive scaling, before you spend to find out.